
Fine particulate matter (PM2.5) in South Korea
Author
admin
Date
2026-07-20 04:33
Views
36
처음으로 다룰 주제는 제 연구와도 관련이 있는 대기오염입니다. 그 중에서도 초미세먼지(PM2.5)1)는 직경이 2.5㎛이하인 먼지이며, 특히 초미세먼지를 흡입했을 때 심장질환, 호흡기질환을 유발하여 조기 사망률을 증가시킬 수 있으며, 피부 염증 및 알레르기를 악화시킬 수 있습니다.
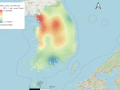
이와 관련하여 2017년도부터 2025년(최신)까지 대한민국의 초미세먼지 경향을 데이터 기반으로 관찰해보았습니다. 데이터는 기후에너지환경부와 한국환경공단이 운영하는 에어코리아(https://www.airkorea.or.kr/)에서 다운로드받았습니다. 아래 초미세먼지 전국 지도는 Ordinary Kriging을 이용하여 전국 665개의 측정소를 기반으로 공간내삽2)하여 추정하였습니다.3)
가장 먼저 확인할 수 있는 가장 중요한 부분은 2017년도부터 최근 2025년까지 PM2.5 농도가 지속적으로 감소하고 있다는 점입니다. 2017년 최대값은 30μg/m³, 최소값은 19μg/m³에서 2025년 최대값은 20μg/m³, 최소값은 13μg/m³으로 약 33% 감소하였습니다. 2018년 강화된 연평균 기준(15㎍/㎥)으로 2017년에는 기준치에 모든 지역이 미치지 못했지만 2025년에는 기준치와 비슷하거나 낮은 지역이 많아졌습니다. 초미세먼지의 연평균 감소추세는 한국환경연구원의 환경 데이터 서비스 포털에서도 찾아볼 수 있습니다 (환경연구원, 2026).
지역별 경향을 보자면, 2017년에는 수도권과 그 주변(평택시, 천안시, 원주시. 당진시) 및 전북특별자치도의 군산시, 익산시 및 전주시가 초미세먼지 수치가 높았습니다. 그러나 2025년에는 수도권 서쪽지역의 농도가 특히 높게 나타났으며, 2017년에 비해 추가적으로 충청북도와 경상북도 북부가 다른 지역에 비해 높은 수준을 보이는 것으로 나타났습니다. 특히 강원대학교 대학원 미세먼지통합관리학과 이상덕 교수 연구팀은 “충청북도의 높은 PM2.5 오염도는 산맥이 대기 정체를 유발했기 때문일 수 있다”고 설명하였으며, “서울 등 수도권에서 불어오는 바람에 오염물질이 실려 오고, 산맥이 오염물질 확산을 방해해 대기 중에 오염물질이 축적된다”고 하였습니다(Lee et al., 2024).
현재까지는 지속적으로 초미세먼지 수치가 감소하고 있지만, ‘한반도 미세먼지 발생과 연관된 대기 패턴 그리고 미래 전망’이라는 논문에 따르면 기후변화에 따라 미래 50년 평균(2050-2099년)을 분석한 결과, 한반도는 겨울에 북서풍이 약화되고, 대기환경이 안정되면서 따듯한 겨울과 함께 미세먼지 농도가 상승할 것이라고 합니다 (이현주 외, 2018; 최용석, 2024).
끝으로 최근 감소하는 초미세먼지와 다르게 우리가 생활하는 대류권 오존 농도가 장기적으로 증가하고 있고, 이는 호흡기 질환, 천식, 폐쇄성 폐질환(Chronic Obstructive Pulmonary Disease, COPD) 등의 질환을 유발할 수 있다고 합니다 (최용석, 2024). 따라서 앞으로는 우리가 미세먼지 뿐만이 아니라 오존에도 관심을 가지고 지켜봐야겠습니다.
각주
1) 초미세먼지는 산업과 관련한 시설, 자동차의 배기가스, 난방 등으로 인해 직접적으로 1차 배출이 이뤄지며, 대기 반응에 의해 황산염, 질산염과 같이 2차 생성되기도 합니다 (서울특별시 대기정책과, 2026).
2) 공간내삽은 공간상의 주어진 위치(포인트)의 값을 이용하여 알려지지 않은 위치에서의 값을 추정하는 방법이다. 그 중 Ordinary Kriging은 미세먼지 값 추정에 많이 활용되며, 알려진 주변 측정값들의 가중치 선형 조합을 활용합니다.
3) Ordinary Kriging은 최첨단 AI기술 및 고해상도 데이터를 활용한 방법이 아니라 정확하게 예측한 지도라고 말하기는 힘들지만 경향을 파악하기에는 충분합니다.
- English version
The first topic I would like to cover is air pollution, which is closely related to my research. Among various pollutants, fine particulate matter (PM2.5}1) refers to particles with a diameter of 2.5㎛ or less. Inhaling PM2.5 can cause cardiovascular and respiratory diseases, increasing premature mortality and can aggravate skin inflammation and allergies.
In this sense, I observed data-driven trends in PM2.5 concentrations in South Korea from 2017 to the most recent year, 2025. The dataset was downloaded from Air Korea (https://www.airkorea.or.kr/), operated by the Ministry of Climate, Energy and Environment and the Korea Environment Corporation. The national PM2.5 maps below were estimated using Ordinary Kriging, which is based on the spatial interpolation2) using the data from 665 monitoring stations across the country.3)
The most notable observation is the continuous decline in PM2.5 levels from 2017 to 2025. In 2017, concentrations ranged from a maximum of 30μg/m³ to a minimum of 19μg/m³. By 2025, these figures dropped to a maximum of 20μg/m³ and a minimum of 13μg/m³, showing an overall decrease of approximately 33%. Based on the reinforced annual average standard (15μg/m³) introduced in 2018, no region met the target in 2017; however, by 2025, many regions exhibited concentration levels comparable to or below the standard threshold. This downward annual trend in PM2.5 can also be corroborated by the Environmental Data Service Portal of the Korea Environment Institute (KEI, 2026).
Looking at regional trends, high PM2.5 levels in 2017 were mainly concentrated in the Seoul Metropolitan Area (SMA) and its surrounding cities (Pyeongtaek, Cheonan, Wonju, and Dangjin), as well as Gunsan, Iksan, and Jeonju in Jeonbuk State. By 2025, however, elevated concentrations were particularly evident in the western part of the SMA. In addition, compared to 2017, Chungcheongbuk-do and northern Gyeongsangbuk-do displayed relatively higher pollution levels than other regions. In this regard, Professor Sang-Deok Lee's research team from the Department of Integrated Particulate Matter Management at Kangwon National University Graduate School explained: "The high PM2.5 pollution in Chungcheongbuk-do may be attributed to mountain ranges inducing atmospheric stagnation." They added, "Pollutants carried by winds blowing from the SMA, including Seoul, accumulate in the atmosphere as the surrounding mountains impede pollutant dispersion" (Lee et al., 2024).
Although PM2.5 levels have been consistently declining so far, a study titled ‘Atmospheric Patterns Associated with Fine Dust Generation on the Korean Peninsula and Future Outlook’ suggests a different scenario. Analyzing the 50-year future average (2050–2099) under climate change projections, the study indicates that winter northwesterly winds over the Korean Peninsula will weaken, and atmospheric conditions will stabilize. This will lead to warmer winter accompanied by an increase in fine particulate concentrations (Lee et al., 2018; Choi, 2024).
Finally, unlike the recent decline in fine dust, tropospheric ozone concentrations in our daily living environment are showing a long-term increasing trend. Tropospheric ozone is known to trigger respiratory illnesses, asthma, and Chronic Obstructive Pulmonary Disease (COPD) (Choi, 2024). Therefore, to move forward, it is essential that we pay close attention not only to particulate matter but also to ozone levels.
Footnotes
1) PM2.5 is directly emitted as a primary pollutant from industrial facilities, vehicle exhaust, and heating, while also being secondarily formed in the atmosphere as compounds such as sulfates and nitrates through chemical reactions (Seoul Metropolitan Government Atmospheric Policy Division, 2026).
2) Spatial Interpolation is a method used to estimate values at unobserved locations using known values at specific spatial locations (points). Among these methods, Ordinary Kriging is widely utilized for estimating particulate matter concentrations by applying a weighted linear combination of surrounding known monitoring values.
3) Since Ordinary Kriging does not incorporate state-of-the-art AI techniques or high-resolution remote sensing or raster datasets, it is difficult to claim that these maps provide perfectly accurate micro-scale predictions. However, it is fully sufficient for capturing national-level spatial trends.
- 참고문헌
이와 관련하여 2017년도부터 2025년(최신)까지 대한민국의 초미세먼지 경향을 데이터 기반으로 관찰해보았습니다. 데이터는 기후에너지환경부와 한국환경공단이 운영하는 에어코리아(https://www.airkorea.or.kr/)에서 다운로드받았습니다. 아래 초미세먼지 전국 지도는 Ordinary Kriging을 이용하여 전국 665개의 측정소를 기반으로 공간내삽2)하여 추정하였습니다.3)
가장 먼저 확인할 수 있는 가장 중요한 부분은 2017년도부터 최근 2025년까지 PM2.5 농도가 지속적으로 감소하고 있다는 점입니다. 2017년 최대값은 30μg/m³, 최소값은 19μg/m³에서 2025년 최대값은 20μg/m³, 최소값은 13μg/m³으로 약 33% 감소하였습니다. 2018년 강화된 연평균 기준(15㎍/㎥)으로 2017년에는 기준치에 모든 지역이 미치지 못했지만 2025년에는 기준치와 비슷하거나 낮은 지역이 많아졌습니다. 초미세먼지의 연평균 감소추세는 한국환경연구원의 환경 데이터 서비스 포털에서도 찾아볼 수 있습니다 (환경연구원, 2026).
지역별 경향을 보자면, 2017년에는 수도권과 그 주변(평택시, 천안시, 원주시. 당진시) 및 전북특별자치도의 군산시, 익산시 및 전주시가 초미세먼지 수치가 높았습니다. 그러나 2025년에는 수도권 서쪽지역의 농도가 특히 높게 나타났으며, 2017년에 비해 추가적으로 충청북도와 경상북도 북부가 다른 지역에 비해 높은 수준을 보이는 것으로 나타났습니다. 특히 강원대학교 대학원 미세먼지통합관리학과 이상덕 교수 연구팀은 “충청북도의 높은 PM2.5 오염도는 산맥이 대기 정체를 유발했기 때문일 수 있다”고 설명하였으며, “서울 등 수도권에서 불어오는 바람에 오염물질이 실려 오고, 산맥이 오염물질 확산을 방해해 대기 중에 오염물질이 축적된다”고 하였습니다(Lee et al., 2024).
현재까지는 지속적으로 초미세먼지 수치가 감소하고 있지만, ‘한반도 미세먼지 발생과 연관된 대기 패턴 그리고 미래 전망’이라는 논문에 따르면 기후변화에 따라 미래 50년 평균(2050-2099년)을 분석한 결과, 한반도는 겨울에 북서풍이 약화되고, 대기환경이 안정되면서 따듯한 겨울과 함께 미세먼지 농도가 상승할 것이라고 합니다 (이현주 외, 2018; 최용석, 2024).
끝으로 최근 감소하는 초미세먼지와 다르게 우리가 생활하는 대류권 오존 농도가 장기적으로 증가하고 있고, 이는 호흡기 질환, 천식, 폐쇄성 폐질환(Chronic Obstructive Pulmonary Disease, COPD) 등의 질환을 유발할 수 있다고 합니다 (최용석, 2024). 따라서 앞으로는 우리가 미세먼지 뿐만이 아니라 오존에도 관심을 가지고 지켜봐야겠습니다.
각주
1) 초미세먼지는 산업과 관련한 시설, 자동차의 배기가스, 난방 등으로 인해 직접적으로 1차 배출이 이뤄지며, 대기 반응에 의해 황산염, 질산염과 같이 2차 생성되기도 합니다 (서울특별시 대기정책과, 2026).
2) 공간내삽은 공간상의 주어진 위치(포인트)의 값을 이용하여 알려지지 않은 위치에서의 값을 추정하는 방법이다. 그 중 Ordinary Kriging은 미세먼지 값 추정에 많이 활용되며, 알려진 주변 측정값들의 가중치 선형 조합을 활용합니다.
3) Ordinary Kriging은 최첨단 AI기술 및 고해상도 데이터를 활용한 방법이 아니라 정확하게 예측한 지도라고 말하기는 힘들지만 경향을 파악하기에는 충분합니다.
- English version
The first topic I would like to cover is air pollution, which is closely related to my research. Among various pollutants, fine particulate matter (PM2.5}1) refers to particles with a diameter of 2.5㎛ or less. Inhaling PM2.5 can cause cardiovascular and respiratory diseases, increasing premature mortality and can aggravate skin inflammation and allergies.
In this sense, I observed data-driven trends in PM2.5 concentrations in South Korea from 2017 to the most recent year, 2025. The dataset was downloaded from Air Korea (https://www.airkorea.or.kr/), operated by the Ministry of Climate, Energy and Environment and the Korea Environment Corporation. The national PM2.5 maps below were estimated using Ordinary Kriging, which is based on the spatial interpolation2) using the data from 665 monitoring stations across the country.3)
The most notable observation is the continuous decline in PM2.5 levels from 2017 to 2025. In 2017, concentrations ranged from a maximum of 30μg/m³ to a minimum of 19μg/m³. By 2025, these figures dropped to a maximum of 20μg/m³ and a minimum of 13μg/m³, showing an overall decrease of approximately 33%. Based on the reinforced annual average standard (15μg/m³) introduced in 2018, no region met the target in 2017; however, by 2025, many regions exhibited concentration levels comparable to or below the standard threshold. This downward annual trend in PM2.5 can also be corroborated by the Environmental Data Service Portal of the Korea Environment Institute (KEI, 2026).
Looking at regional trends, high PM2.5 levels in 2017 were mainly concentrated in the Seoul Metropolitan Area (SMA) and its surrounding cities (Pyeongtaek, Cheonan, Wonju, and Dangjin), as well as Gunsan, Iksan, and Jeonju in Jeonbuk State. By 2025, however, elevated concentrations were particularly evident in the western part of the SMA. In addition, compared to 2017, Chungcheongbuk-do and northern Gyeongsangbuk-do displayed relatively higher pollution levels than other regions. In this regard, Professor Sang-Deok Lee's research team from the Department of Integrated Particulate Matter Management at Kangwon National University Graduate School explained: "The high PM2.5 pollution in Chungcheongbuk-do may be attributed to mountain ranges inducing atmospheric stagnation." They added, "Pollutants carried by winds blowing from the SMA, including Seoul, accumulate in the atmosphere as the surrounding mountains impede pollutant dispersion" (Lee et al., 2024).
Although PM2.5 levels have been consistently declining so far, a study titled ‘Atmospheric Patterns Associated with Fine Dust Generation on the Korean Peninsula and Future Outlook’ suggests a different scenario. Analyzing the 50-year future average (2050–2099) under climate change projections, the study indicates that winter northwesterly winds over the Korean Peninsula will weaken, and atmospheric conditions will stabilize. This will lead to warmer winter accompanied by an increase in fine particulate concentrations (Lee et al., 2018; Choi, 2024).
Finally, unlike the recent decline in fine dust, tropospheric ozone concentrations in our daily living environment are showing a long-term increasing trend. Tropospheric ozone is known to trigger respiratory illnesses, asthma, and Chronic Obstructive Pulmonary Disease (COPD) (Choi, 2024). Therefore, to move forward, it is essential that we pay close attention not only to particulate matter but also to ozone levels.
Footnotes
1) PM2.5 is directly emitted as a primary pollutant from industrial facilities, vehicle exhaust, and heating, while also being secondarily formed in the atmosphere as compounds such as sulfates and nitrates through chemical reactions (Seoul Metropolitan Government Atmospheric Policy Division, 2026).
2) Spatial Interpolation is a method used to estimate values at unobserved locations using known values at specific spatial locations (points). Among these methods, Ordinary Kriging is widely utilized for estimating particulate matter concentrations by applying a weighted linear combination of surrounding known monitoring values.
3) Since Ordinary Kriging does not incorporate state-of-the-art AI techniques or high-resolution remote sensing or raster datasets, it is difficult to claim that these maps provide perfectly accurate micro-scale predictions. However, it is fully sufficient for capturing national-level spatial trends.
- 참고문헌
- 서울특별시 대기정책과, (2026). https://cleanair.seoul.go.kr/information/info11#about
- 이현주, 정여민, 김선태, & 이우섭. (2018). 한반도 미세먼지 발생과 연관된 대기패턴 그리고 미래 전망. 한국기후변화학회지, 9(4), 423-433.
- 최용석 (2024). 미세먼지, 이을출판사, 서울 대한민국.
- 환경연구원, (2026). https://data.kei.re.kr/service/media/?itemId=98fdacd3-d7ae-4f2e-b6bc-861b7e3a1643
- Lee, U. J., Kim, M. J., Kim, E. J., Lee, D. W., & Lee, S. D. (2024). Spatial distribution characteristics and analysis of PM2. 5 in South Korea: a geographically weighted regression analysis. Atmosphere, 15(1), 69. https://doi.org/10.3390/atmos15010069
Total 2
| Number | Thumbnail | Title | Author | Date | Votes | Views |
| 1 |
|

admin
|
2026.07.20
|
Votes 0
|
Views 36
|
admin | 2026.07.20 | 0 | 36 |
| 2 |

|

admin
|
2026.03.28
|
Votes 0
|
Views 73
|
admin | 2026.03.28 | 0 | 73 |